Map Time Series
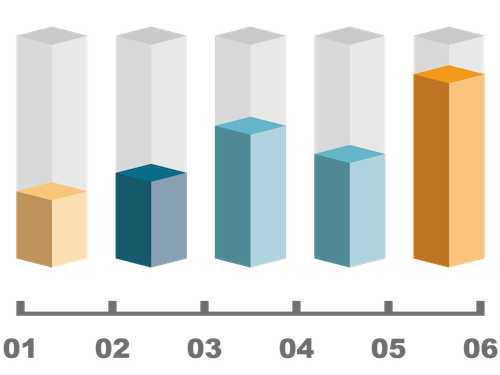
Visualize Geographic Data over TimeTime series data is a collection of values that are assembled over even intervals in time and ordered chronologically.
This data can then be displayed on our maps and viewed using an interactive slider. For subscribers we offer GIF and movie file downloads of the animation.

| Code | Country | Value |
|---|
In order to structure time series data properly you need to create a multi-dimensional object with each year being the key. Then you push your normal geographic data into each year that it is applicable. The resulting object structure should look like the example given.
Supported File Types
JS
JSON
PHP
{
"2001":{
"USA":{"country":"United States","value":3},
"CAN":{"country":"Canada","value":6},
"MEX":{"country":"Mexico","value":9},
},
"2002":{
"USA":{"country":"United States","value":12},
"CAN":{"country":"Canada","value":15},
"MEX":{"country":"Mexico","value":18},
}
}
<?php
$data_ts = array(
"2001" => array(
"USA" => array("value" => 3,"country" => "United States"),
"CAN" => array("value" => 4,"country" => "Canada"),
"MEX" => array("value" => 5,"country" => "Mexico"),
"RUS" => array("value" => 6,"country" => "Russia"),
"AUS" => array("value" => 7,"country" => "Australia")
),
"2002" => array(
"USA" => array("value" => 5,"country" => "United States"),
"CAN" => array("value" => 6,"country" => "Canada"),
"MEX" => array("value" => 7,"country" => "Mexico"),
"RUS" => array("value" => 8,"country" => "Russia"),
"AUS" => array("value" => 9,"country" => "Australia")
)
);
?>
Download Sample Files
Supported File Types
TXT
RTF
XML
CSV
TSV
year,code,country,value
2000,USA,United States,3
2000,CAN,Canada,4
2000,MEX,Mexico,5
2000,RUS,Russia,6
2000,AUS,Australia,7
2001,USA,United States,5
2001,CAN,Canada,6
2001,MEX,Mexico,7
2001,RUS,Russia,8
2001,AUS,Australia,9
<?xml version="1.0" encoding="UTF-8" ?>
<xml>
<_2001>
<USA>
<country>United States</country>
<value>3</value>
</USA>
<CAN>
<country>Canada</country>
<value>4</value>
</CAN>
<MEX>
<country>Mexico</country>
<value>5</value>
</MEX>
<RUS>
<country>Russia</country>
<value>6</value>
</RUS>
<AUS>
<country>Australia</country>
<value>7</value>
</AUS>
</_2001> <_2002><USA>
<country>United States</country>
<value>5</value>
</USA>
<CAN>
<country>Canada</country>
<value>6</value>
</CAN>
<MEX>
<country>Mexico</country>
<value>7</value>
</MEX>
<RUS>
<country>Russia</country>
<value>8</value>
</RUS>
<AUS>
<country>Australia</country>
<value>9</value>
</AUS>
</_2002>
</xml>
Download Sample Files
In order to properly apply data within your spreadsheet to the map please format it properly using the following template guides.
* You must include column names in your spreadsheet file.
* Long form time series data is preferred.
Supported File Types
XLS
XLSX
ODS
Download Sample Files
* Not Recommended
Wide Form
In wide format time series data, a subject's repeated values will be in a single row, and each response in a separate column. This is not a recommended format for time series data as it exponentially increases the size of the file with each year and country added.
| code | country | 2001 | 2002 |
| USA | United States | 3 | 9 |
| CAN | Canada | 6 | 12 |
* You can switch between these forms in Excel using pivot tables.
* Recommended
Long Form
In the long format, each row is one time point per subject. So each subject (county) will have data in multiple rows. Any variables that don’t change across time will have the same value in all the rows.
| year | code | country | value |
| 2001 | USA | United States | 3 |
| 2001 | CAN | Canada | 6 |
| 2002 | USA | United States | 9 |
| 2002 | CAN | Canada | 12 |
We provide support for the following time series date formats. Presently it will extract only the year from each format as this is the only range of time allowed at the moment.
Supported Time Series Formats
- Year
- yyyy
- Month
- yyyy/mm
- yyyy-mm
- yyyy.mm
- Full Date (ISO)
- yyyy-mm-dd
- yyyy/mm/dd
- yyyy.mm.dd
- Full Date (US)
- mm-dd-yyyy
- mm/dd/yyyy
- mm.dd.yyyy
- Full Date (EU)
- dd-mm-yyyy
- dd/mm/yyyy
- dd.mm.yyyy

