Map Colors
Manually Add Colors
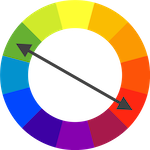
Colors can make or break your data visualization. A carefully selected color palette helps you to harness the pre-attentive processing powers of the human brain, and makes insight clearer and easier to find.
A badly chosen color palette obscures the information your users need to understand, and makes your data visualization less effective and harder to use.
You can easily assign colors to your maps and data manually using the following schema. Colors are accepted in the following format "#FFFFFF" with a hashtag prefix.
References:
[1] Colour Lovers
[2] Color Brewer 2
fills: {
'defaultFill': '#306596',
'MIN': '#0fa0fa',
'MAX': '#bada55'
}
data: {
USA: {fillKey: 'defaultFill', value: 3},
CAN: {fillKey: 'MIN', value: 4},
MEX: {fillKey: 'MAX', value: 5}
}
You can use the automatic scaling option to assign colors based on the relation of values to each other in a Javascript array.
Simply insert the values for the minimum and maximum values and the program will calculate and assign colors automatically.
var series = [["USA",75],["CAN",43],["MEX",50]];
var dataset = {};
var onlyValues = series.map(function(obj){return obj[1];});
var minValue = Math.min.apply(null, onlyValues),
maxValue = Math.max.apply(null, onlyValues);
var paletteScale = d3.scale.linear()
.domain([minValue,maxValue])
.range(["#EFEFFF","#02386F"]);
series.forEach(function(item){
var iso = item[0],
value = item[1];
dataset[iso] = {
numberOfThings: value, fillColor: paletteScale(value)
};
});
new Datamap({
element: document.getElementById('world-map'),
projection: 'mercator',
fills: { defaultFill: '#F5F5F5' },
data: dataset,
geographyConfig: {
borderColor: '#DEDEDE',
highlightBorderWidth: 2,
highlightFillColor: function(geo) {
return geo['fillColor'] || '#F5F5F5';
},
highlightBorderColor: '#B7B7B7',
popupTemplate: function(geo, data) {
if (!data) { return ; }
return ['<div class="hoverinfo">',
'<strong>', geo.properties.name, '</strong>',
'<br>Count: <strong>', data.numberOfThings, '</strong>',
'</div>'].join('');
}
}
});